Summary
In order to improve user experience and maintain market competitiveness, Chaos Labs presents a series of improvements to the JLP loan parameters that better compensate liquidity providers for the risk they take on from temporary imbalances in pool composition.
| Parameter Name | Current | Recommended |
|---|---|---|
maintainance_margin_bps |
8000 bps (80%) | 9000 bps (90%) |
liquidation_margin |
8600 bps (86%) | 9500 bps (95%) |
liquidation_fee_bps |
600 bps (6%) | 200 bps (2%) |
Upon implementation, Chaos Labs will monitor both USDC borrows via JLP loans and executed liquidations in order to evaluate how the new parameter set behaves under live market conditions.
Problem Statement
The key failure case to avoid here is that when there is a delay between the time when a position becomes eligible for liquidation and the time when the liquidation transaction is executed, a potential large price movement can leave JLP liquidity providers with bad debt. To give an illustrative example, if there is a liquidation threshold of 98%, and the value of the underlying collateral drops by 3% in the time it takes to execute the liquidation, this leftover 1% becomes bad debt that must be paid for by platform LPs.
Safety Buffer
In order to combat this, we here introduce a safety buffer , defined as an addition to the Liquidation Threshold that protects against this bad debt brought by delayed transaction execution and price volatility. In the above example, a safety buffer of 1 percent (0.01) would have been sufficient to prevent the LP losses.
Methodology
To arrive at a safety buffer value that both allows Jupiter to offer a competitive loan product and protects against the expected price movements in JLP, we first define the P99+ price movements that we will be hedging against. We do this by taking a price series of JLP data at 5-minute intervals, and calculating the P99.9, P99.99, and P99.999 values, respectively equating to the largest 0.1%, 0.01% and 0.001% of price movements found in the given data set. Using the same methodology, we also derive the accompanying maximum 1-minute values.
Safe Liquidity Margin at Various Fee Levels
The formula for deriving an appropriate safety buffer for a given parameter set is defined as follows:
We classify a parameter combination as safe if the safety buffer is sufficient to cover the P99 price movement in the expected delay period.
Results
JLP Volatility
| Percentile | Price Change, 5min | Price Change, 1min |
|---|---|---|
| p95 | 0.2187% | 0.0978% |
| p99 | 0.4109% | 0.1837% |
| p99.9 | 0.8818% | 0.3944% |
| p99.99 | 1.6908% | 0.7561% |
| p99.999 | 2.5416% | 1.1366% |
USDC Weightage Dynamics
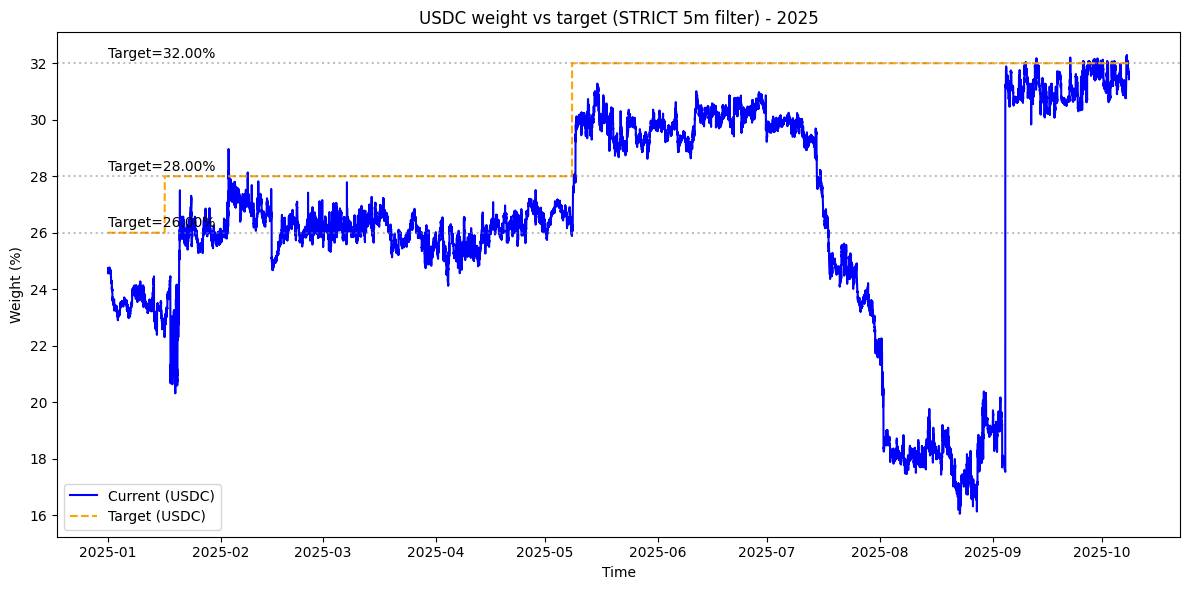
Chart 1: USDC weightage and targets, year-to-date
USDC weighting is here defined as the proportion of USDC in the JLP pool relative to the total pool AUM. It is measured at 5-minute intervals, in line with the volatility analysis. We observe that the USDC weightage in the JLP Pool often drifts below target, though in most cases it stays within ±2% of target. We measure the duration of out-of-band episodes to understand how long, on average, the pool remains unbalanced:
| Metric | Value |
|---|---|
| Episodes (count) | 483 |
| Median Reversion to 2% band | 35 minutes |
| P90 reversion | 10.2 hours |
| P99 reversion | 3.4 days |
| P99.99 reversion | 53.5 days |
| Max. Deviation | 15.95% |
| Max Deviation Time | 2025-08-22 22:10:45 |
| Max Peak to Band Reversion Time | 12.5 days |
Choosing the Liquidation Penalty
When a position is liquidated, the JLP pool can become temporarily unbalanced. For example, given the allocation at the time of writing of ~46% SOL, 8% ETH, 13% BTC, and 33% USDC, a large liquidation could shift the pool to ~50% SOL, 9% ETH, 16% BTC, and 25% USDC (Example figures). In this state, JLP would be overweight in volatile assets and underweight in USDC, leading to an inflated level of price exposure and potentially further drawdowns until the targeted balance is restored.
To set an appropriate liquidation penalty, we account for two distinct risks:
-
JLP Price Volatility
Although liquidations are typically executed within seconds, there remains a small execution gap risk. JLP has experienced one-minute drawdowns of 0.4–1.1%, and 5-minute drawdowns of 0.9–2.5%.
-
Prolonged Imbalance
While most USDC deviations within ±2% resolve quickly (the median is ~35 minutes), we observe a fat-tailed distribution; P99 reversion to ±2% takes ~3.4 days, and in extreme cases, the imbalances have persisted for over 50 days. During these periods, LPs are underweight USDC, which amplifies effective volatility and compounds risk.
In order to compensate LPs for both short-term price volatility and the possibility of prolonged imbalance, Chaos Labs proposes a liquidation penalty framework of 2%–6%, which will be sufficient to cover extreme cases of both of these risk vectors.
Secure Liquidation LTV by Fee Levels
The tables below present the liquidation_margin levels deemed safe for different liquidation fee values. We compute these values for both the 1-minute and 5-minute price volatility; the 5-minute figures are more conservative, as they protect against a longer delay in liquidation execution, whereas the 1-minute figures allow for more competitive LTV levels.
Values - 5 min
liquidation_fee_bps (in %) |
**Maxliquidation_margin |
p99.9 (0.8818%)** | **Maxliquidation_margin |
p99.99 (1.6908%)** | **Maxliquidation_margin |
p99.999 (2.5416%)** |
|---|---|---|---|---|---|---|
| 6% | 93% | 92% | 91% | |||
| 5% | 94% | 93% | 92% | |||
| 4% | 95% | 94% | 93% | |||
| 3% | 96% | 95% | 94% | |||
| 2% | 97% | 96% | 95% |
Values - 1 min
liquidation_fee_bps (in %) |
Maxliquidation_margin(in %) safe vs p99.9 (0.3944%) |
Maxliquidation_margin(in %) vs p99.99 (0.7561%) |
Maxliquidation_margin(in %) vs p99.999 (1.1366%) |
|---|---|---|---|
| 6% | 93% | 93% | 93% |
| 5% | 94% | 94% | 94% |
| 4% | 95% | 95% | 95% |
| 3% | 96% | 96% | 95% |
| 2% | 97% | 97% | 96% |
Recommendation
As mentioned above, the liquidation_fee_bps must compensate LPs for both immediate volatility shocks and the potential for prolonged imbalance. The research above shows that a reasonable framework is 200-600bps, but given that liquidation execution can be expected to be near-instant in the overwhelming majority of cases, Chaos Labs recommends adopting the lower bound of 200bps, and to raise the maintainance_margin_bps from 8000 to 9000 bps, allowing for improved borrower capital efficiency while keeping JLP Loans competitive with the market. At a liquidation_fee_bps value of 200 bps, a liquidation_margin between 9400 and 9500 bps aligns with the safety margins observed in the 5-minute volatility distribution.