Summary
Considering the current utilization of SOL and the realized borrowing rates, Chaos Labs recommends adjusting SOL’s jumpRateState parameters and running this configuration for a two-week test period. The recommendations are as follows:
| Parameter | Current | Recommended |
|---|---|---|
| minRateBps | 1,000 | 1,000 |
| targetRateBps | 6,000 | 3,500 |
| maxRateBps | 23,000 | 15,000 |
| targetUtilizationRate | 800,000,000 | 800,000,000 |
Introduction
Despite SOL’s deep liquidity base, utilization has remained structurally below that of WBTC and WETH, with borrowers consistently facing elevated costs at moderate utilization levels. By reducing the targetRateBps and maxRateBps, the proposed adjustments aim to lower borrowing costs in the 20–40% utilization range, stimulate demand, and bring SOL’s borrow curve closer in line with comparable WBTC and WETH markets.
Historical Analysis
Observed period: 20/6/2025-20/9/2025.
This section reviews utilization, borrowing costs, and liquidity patterns over the past three months to establish the historical context behind SOL’s persistently lower utilization relative to WBTC and WETH.
Overall Picture of Utilization

Figure 1. Utilization trends over the past 3 months.
Over the past 3 months, SOL utilization has remained significantly below that of WBTC and WETH. While WBTC and WETH frequently operated in the 40–70 percent range, SOL hovered closer to 20–35 percent.

Figure 2. Utilization distribution over the past 3 months.
The distribution confirms this gap, with SOL tightly clustered around a median of ~28 percent, compared to 45 and 42 percent for WBTC and WETH. The persistence of this low-utilization regime suggests it is structural rather than a short-lived fluctuation.

Figure 3. Borrow APR over the past 3 months for SOL, WBTC, and WETH.
Borrowers consistently faced higher costs on SOL. Rates were typically 25–35 percent, while WBTC and WETH averaged closer to 14–20 percent, even at moderate utilization levels well below the kink point.
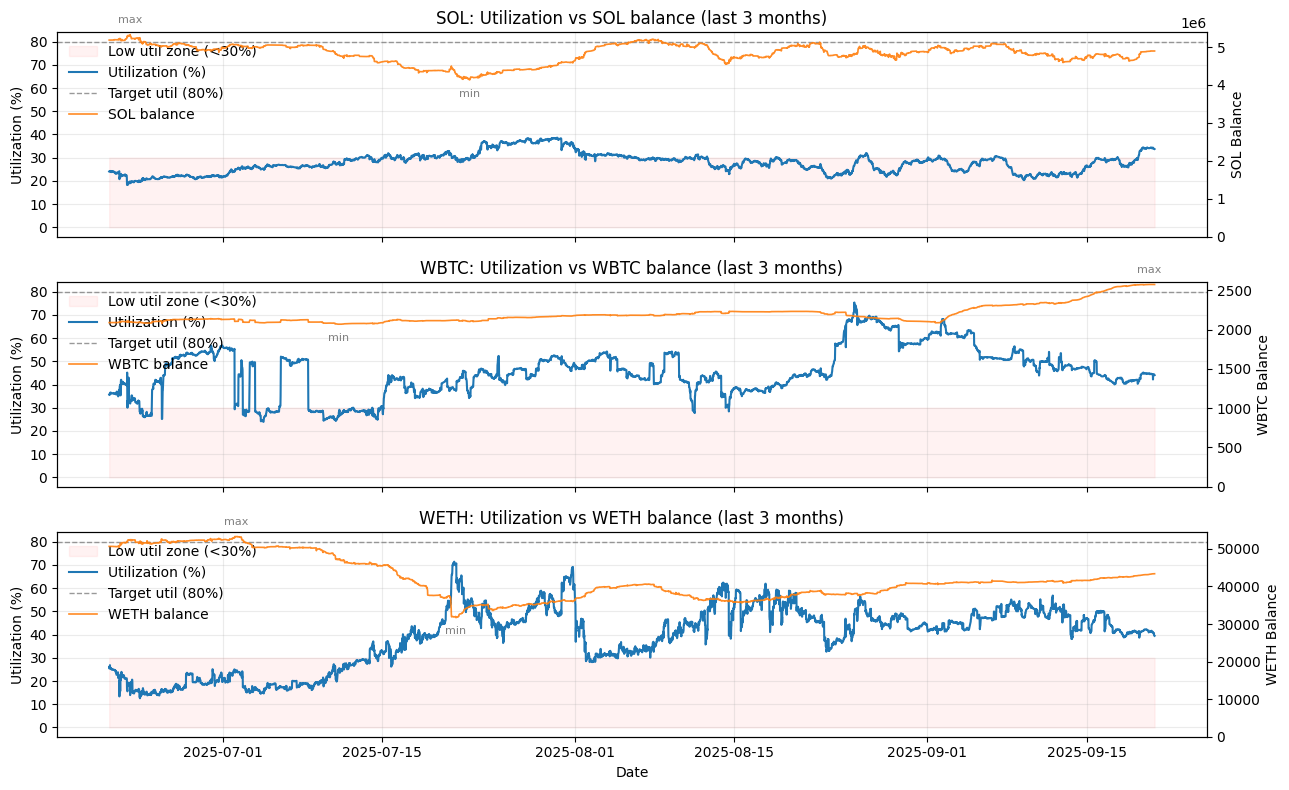
Figure 4. Utilization vs Token Balance of the past 3 months.
Liquidity levels reinforce this picture. SOL balances averaged 4.5–5 million tokens, equivalent to $700M–$1.2B, compared with $200–300M for WBTC and $100–200M for WETH. This much larger base dilutes utilization.

Figure 5. Dollar value of liquidity in the JLP for SOL, WBTC, and WETH.
This scale difference confirms that abundant supply is an important factor behind SOL’s persistently low utilization: even moderate borrowing demand is diluted against a disproportionately large pool of liquidity. However, supply-side effects alone may not fully explain the outcome, and the role of SOL’s steep borrow rate curve will be examined in the next section.
Borrow-Rate Sensitivity and Drivers of SOL Utilization
SOL utilization runs structurally below WBTC and WETH. Two explanations are possible: borrowing may be discouraged by SOL’s steep rate curve, which makes leverage expensive even at moderate utilization, or it may reflect dilution from a larger liquidity base.
We address this in two parts:
-
Rate steepness: We compute model-implied APRs from each asset’s jump-rate curve and compare across typical utilization ranges. SOL’s curve is substantially steeper, implying that borrowers face higher costs even at moderate utilization levels. If demand is rate-sensitive, this pricing should suppress borrowing and keep utilization low.
-
We isolate hours when APR changes are driven by liquidity inflows or outflows rather than borrower activity. These shocks shift the rate exogenously and allow us to test whether higher costs reduce subsequent borrowing.
Rate Steepness
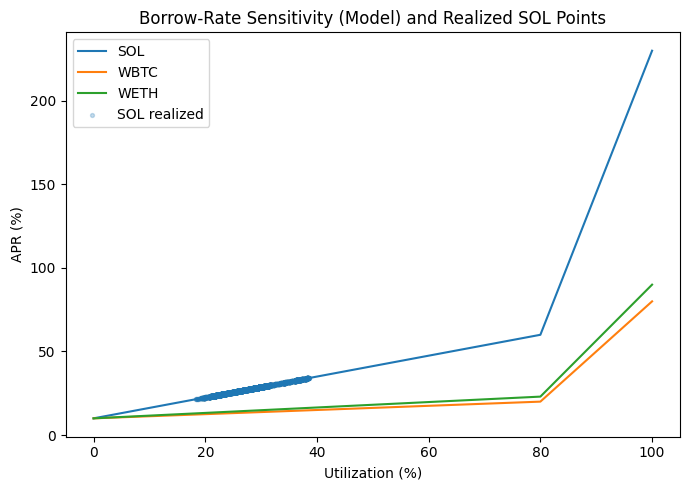
Figure 6. Borrow rate sensitivity and actual SOL borrowing rates over past 3 months.
Actual SOL borrow rates cluster tightly in the 20–40% utilization range, meaning borrowers rarely faced “cheap” conditions and instead operated in a high-cost regime. This confirms that SOL’s steep curve exposes borrowers to higher effective costs at typical utilization levels, which can discourage borrowing and contribute to persistently lower utilization compared to WBTC and WETH.
Steepness alone doesn’t prove causality. The next section asks: when APR moves mostly because liquidity moves (demand change in SOL has a small contribution), do borrowers respond? If yes, the curve itself is influencing the demand.
Behavioral Sensitivity
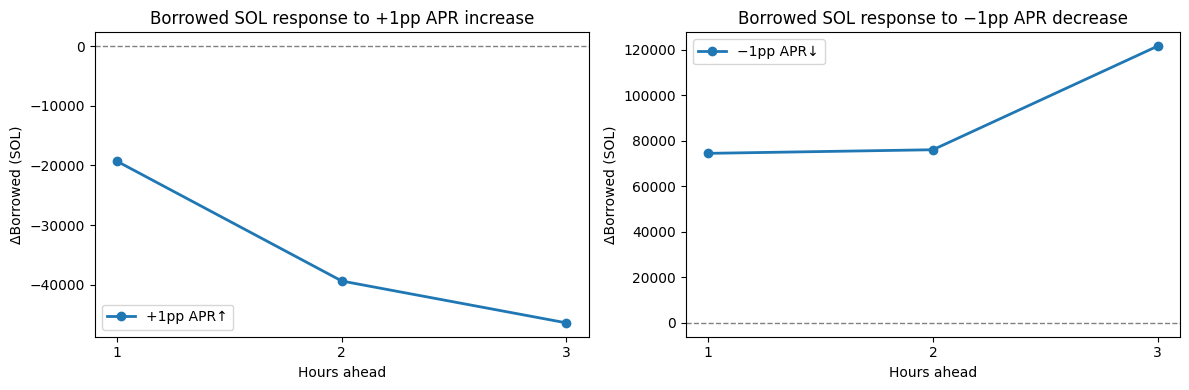
Figure 6. User’s response to the change in APR.
Borrowers do respond, but the evidence shows an asymmetric pattern. When APR rises due to outflows, borrowing declines modestly, with negative coefficients that are small and imprecisely estimated. When APR falls due to inflows, borrowing increases strongly, with effects of roughly 70k to 120k SOL within three hours that are statistically significant. A symmetry test shows the difference: cuts stimulate borrowing much more than hikes suppress it.
Recommendations
The analysis shows that SOL’s low utilization reflects both abundant supply and the shape of its borrow curve, but the curve itself plays a causal role in suppressing demand. Our causal tests suggest that when APR rises due to supply outflows, borrowing weakens, while APR cuts from inflows lead to large and immediate increases in demand. This asymmetry highlights that the current curve discourages sustained utilization once the pool tightens.
To address this, Chaos Labs proposes lowering the slope of SOL’s borrow curve in the 30–50% utilization range. Bringing SOL’s curve closer to WBTC and WETH would reduce borrowing costs at moderate utilization while still preserving steep penalties near full utilization.
A key input to our parameter choice is relative volatility of the underlying assets year to date. Higher-volatility assets can justify higher borrow costs.
| Symbol | Observations (days) | Mean daily return (%) | Daily vol (std) (%) | Annualized vol (%) |
|---|---|---|---|---|
| SOL | 262 | 0.09 | 3.63 | 69.29 |
| WBTC | 262 | 0.08 | 1.63 | 31.20 |
| WETH | 262 | 0.11 | 3.16 | 60.46 |
Anchoring the curve to relative volatilities, we keep the minRateBps at 1,000 to maintain a non-zero baseline cost across assets. The targetRateBps is reduced to 3,500, roughly halfway between WBTC/WETH (2,000 - 2,300) and the old SOL level of 6,000. This reflects SOL’s higher volatility while avoiding the ~2× premium that previously suppressed borrowing. At 30% utilization, this translates to ~19% APR, about 25% higher than WETH’s ~15%. This premium slightly overshoots the volatility gap between SOL (69%) and WETH (60%). The 3,500 targetRateBps should therefore be viewed as a conservative starting point, with the option to bring it down toward ~3,100 in future if utilization remains low. Finally, the maxRateBps is lowered from 23,000 to 15,000, keeping it steeper than WBTC/WETH (8,000–9,000) in line with risk but eliminating the extreme 200%+ APR overshoot.
Recommended parameter values:
| Parameter | Current | Recommended |
|---|---|---|
| minRateBps | 1,000 | 1,000 |
| targetRateBps | 6,000 | 3,500 |
| maxRateBps | 23,000 | 15,000 |
| targetUtilizationRate | 800,000,000 | 800,000,000 |
If these changes are adopted, Chaos Labs will monitor utilization and borrowing dynamics over a trial period of two weeks. Based on observed behavior, further fine-tuning may be proposed to ensure the parameters remain both competitive and safe for the protocol.

Figure 7. Current vs proposed SOL Borrow APR at various utilization levels. x
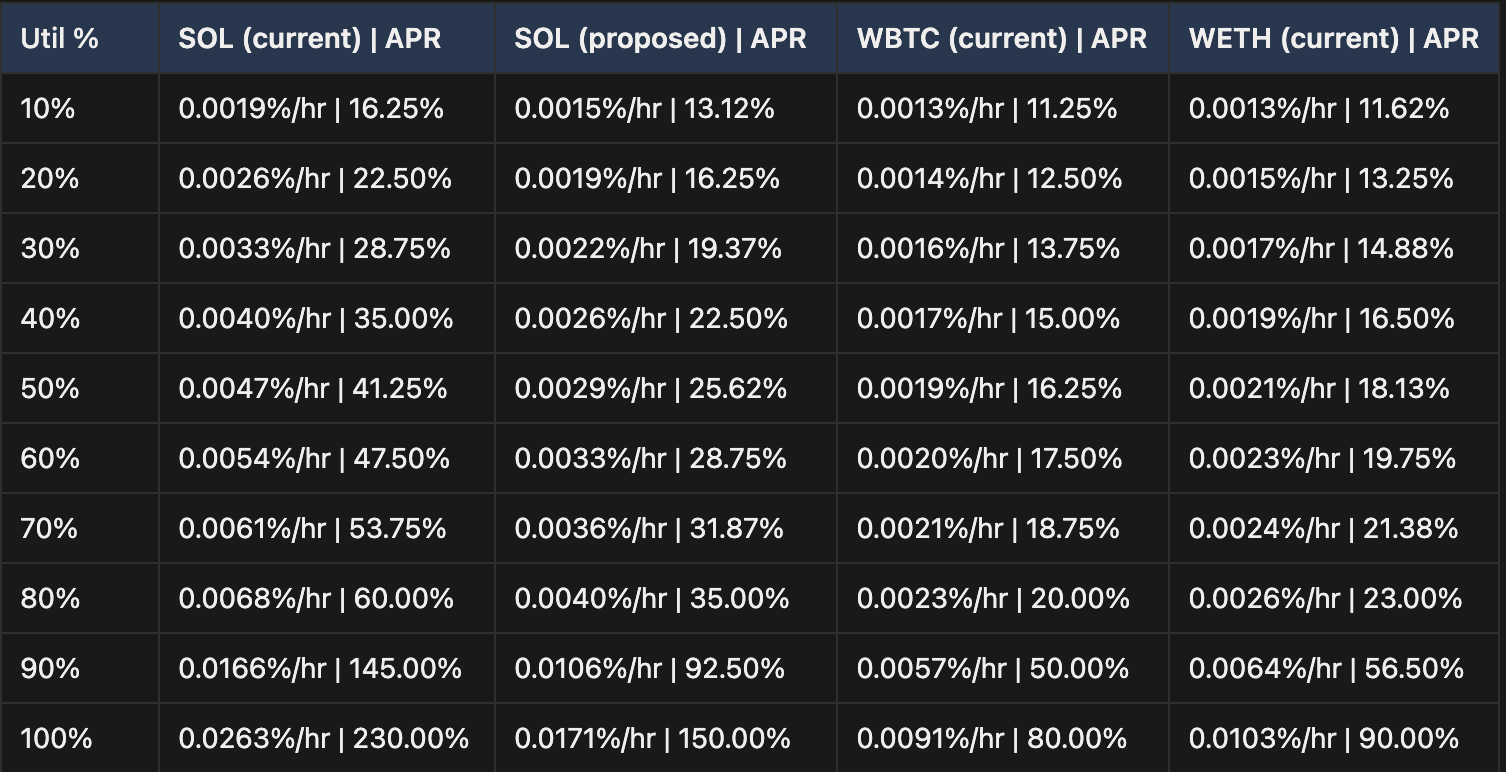
To observe the change on borrow APR we calculate the borrow rate for SOL on for the previous 90 days with the recommended parameter values:

Figure 8. Simulated SOL borrow rates over the past three months under the recommended settings, compared against real WBTC and WETH borrowing rates.
Under current parameters, SOL borrowers consistently faced 25–33% APRs, even when utilization stayed in the mid-20–30% range.
The proposed curve would have reduced those costs to 15–21%, bringing SOL’s borrowing environment much closer to WBTC and WETH at lower utilization levels.