Summary
This post examines the impact of Jupiter’s June 11 price impact function update on trading volumes across key SOL, ETH, and BTC markets. Using statistical tests and comparative analysis of daily volumes across defined pre-and post-update periods, we identify a decline in SOL trading volume, a mild reduction in ETH activity, and no meaningful change for BTC. We also explore changes in trade-size distributions, and provide parameter recommendations to address the observed volume shifts.
Identifying the Drop in Volumes After the Change
SOL trading volume declined markedly post-change, both in daily values and in the smoothed trend. This market appears to have been the most affected by the fee mechanism update.

ETH trading volume appears more volatile. While there is some softening post-change, the pattern is less definitive than in SOL.

BTC trading volume shows no meaningful change in trend or volatility after June 11. This can indicate that the observed decline in SOL (and to some extent ETH) was not a universal pattern across all markets.

Statistical Results
SOL
Average daily SOL trading volume declined 21.4% in the 90-day window and 27.9% in the 70-day window following the June 11 pricing formula change. The decline is statistically significant in both windows, with both the t-test and Mann-Whitney U test yielding p-values well below 0.01. Although normality is slightly violated (Shapiro p-values < 0.05), the consistency between both parametric and non-parametric tests strengthens the evidence for a real volume contraction. These results suggest the decline in volume coincided with the update, though other factors cannot be ruled out.
ETH
Average daily ETH volume also declined after the formula change, by 7.9% in the 90-day window and 17.4% in the 70-day window. However, this decline is not statistically significant, with p-values from both the t-test and Mann–Whitney U test above 0.10 in the 90-day window, and just above the 0.10 threshold in the 70-day window. The drop in the 70-day window is more pronounced numerically, but still lacks statistical support. These results suggest that while ETH activity may have softened, natural variation cannot be ruled out as the cause.
BTC
BTC shows no meaningful change in average daily trading volume following the formula adjustment. In fact, average daily volume increased slightly in the 90-day window (+2.6%) and declined marginally in the 70-day window (–2.4%). Both t-test and Mann-Whitney U test p-values are well above 0.60 in both windows, providing strong evidence against any statistically significant volume shift. BTC trading activity remained stable across the observed period, with no indication of a trend change associated with the update.
Estimating the Direction and Size of Volume Trends with OLS
When estimating the direction and size of volume trends with OLS we identified the following:
Sol Volume - The post-update trend shows a significant decline (p = 0.005), while the pre-update slope is statistically flat.
ETH Volume- Pre-update slope was upward but not significant; post-update decline (p = 0.027) may reflect emerging sensitivity to fee structure changes.
BTC Volume -Trends in both periods are flat and statistically insignificant, indicating that volume dynamics were likely unaffected.
The Mann-Kendall and OLS results appear to show that downward trends in SOL and ETH volume began only after the formula update. While this pattern is statistically supported, attributing it solely to the parameter change would require further analysis of market-wide and external factors.
While causality cannot be definitively established, the timing and statistical evidence point to a possible volume response in ETH and SOL markets.
Trading Volume Analysis
In order to evaluate where the PI fees have impacted user behavior the most, we examine the two factors that determine PI fees - trade size and OI imbalance within the 10-minute window.
Changes in Large Trades
First, we will explore the impact of large trades at or above $1M, as they make up most of the volume on Jupiter and are subject to higher price impact when compared to CEXs like Binance. The selection of $1M as the large trade identifier is also supported by the recent reduction of the imbalance threshold to $750K.
Any discrepancy in large trades may be attributed to the linear portion of the price impact function, and it can only be alleviated to a certain extent by the parameters of the new price impact function. Increasing price impact fee scalars can control this increase in price impact fees for large trades much more efficiently, even without touching the base fee.
Below, we compare the contribution of large trades to the total volume observed on Jupiter within the last 60 days, as they are the ones most affected by Jupiter’s price impact function.
We see no obvious downtrend in the SOL, ETH, or BTC Large Trade Volume Ratio, indicating that trade size-driven PI fees alone are not the main factor to explain the volume change.
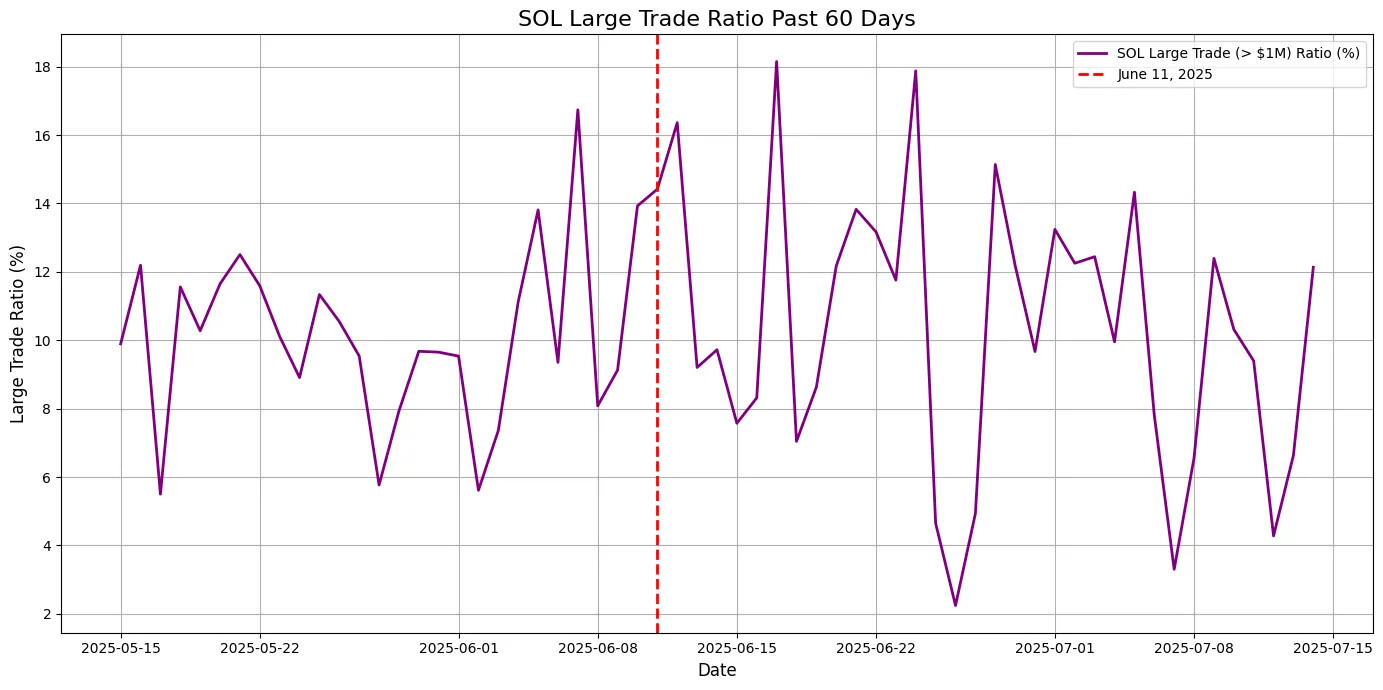


The median trade size on Jupiter, ~3K for all three markets, is considerably lower when compared to the imbalance threshold. However, imbalances accumulated within the time window may cause higher price impact fees. In summary, the trade distribution between small trades and large trades has remained consistent after the change.
Changes in Window Imbalance
Below we explore whether there were changes in trading volume across 10-minute intervals following the June 11 price impact fee update.
SOL
The histogram shows that the shape of the 10-minute volume distribution remained broadly right-skewed after the update, but with an overall decline in frequency across all volume levels. The frequency of high-volume windows dropped sharply, and most trading activity continued to concentrate in the low-to-mid volume range, though at lower intensity post-update.

ETH
The histogram shows a stable, heavy-tailed distribution before and after the update, but with noticeably fewer extremely high-volume windows post-update. The tail shortened, and mid-range bins became more concentrated, pointing to less frequent large bursts.

BTC
The histogram shows that BTC’s 10-minute volumes remained heavy-tailed, but post-update, low-volume windows became less common, while mid-to-high volume windows thinned out. Notably, a few very large spikes appeared after the update, pushing the max volume higher. This suggests more fragmented trading overall, with occasional large bursts.

Trade Volume Analysis Conclusions
The June 11 adjustment to the price impact function was followed by measurable changes in trading behavior across SOL, ETH, and BTC markets, with varying effects across assets.
SOL experienced a clear and statistically significant decline in daily trading volume, supported by both level comparisons and trend analyses. Post-update, volumes decreased by over 20%, and a negative trend emerged where none was previously observed.
ETH volumes declined as well, though the changes were not statistically significant at the daily level. However, post-update trends suggest a shift toward lower activity, and the intra-day volume distribution became more concentrated.
BTC volumes remained stable in aggregate, with no significant changes in trend or average daily activity. Still, the post-update distribution of 10-minute volumes became more polarized.
While broader market dynamics may have also played a role, the alignment of timing and statistical patterns indicates that the formula update likely contributed to the observed shifts in trading behavior, particularly in SOL and, to a lesser extent, ETH. Further monitoring would be required to isolate the effect and assess persistence.
Parameter Recommendations
Given the trade and volume analysis results, we have examined several options and produced a new set of recommendations, changing the Delta Imbalance Threshold from $750K to $1.5M. As BTC did not exhibit any drop in volumes, we do not recommend changing parameters at this point.
| Parameter | SOL | ETH |
|---|---|---|
| Delta Imbalance Threshold | 1.5e6 | 1.5e6 |
| Price Impact Factor | 1.0e-04 | 1.0e-04 |
| Price Impact Exponent | 1 | 1 |
| Base Fee | 6 | 6 |
| Trade Impact Fee Scalar | 1.25e9 | 5e9 |
| Max Fee | 50bps | 50bps |
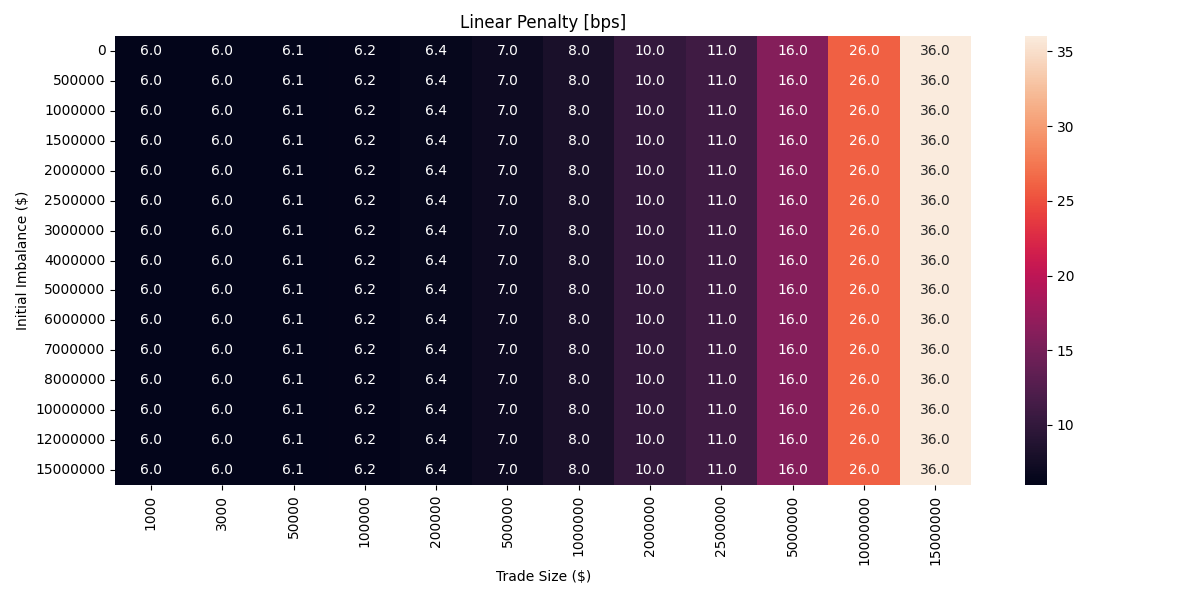
The new parameter recommendations will produce a behavior much closer to that of the previous Linear penalty under even bigger OI imbalance, while still providing protection during extreme spikes. Below, we include the heatmaps showing the PI fees under the new recommended parameters for ETH and SOL, together with the heatmaps of PI fees under the current parameter settings and the previous linear model. The new parameter recommendations aim to offer a balanced alternative between the two, offering lower PI fees while preserving protection under extremely high imbalance. We will continue monitoring trading volumes to verify that we observe an uptrend back to previous levels.
SOL


ETH


Disclaimer
Chaos Labs has not been compensated by any third party for publishing this forum post.
Copyright
Copyright and related rights waived via CC0